


The real carbon intensity of photovoltaic energy
An update on the disagreement with Seaver Wang

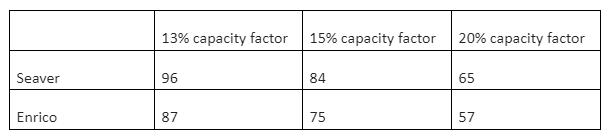
Since Public reported on my lifetime carbon assessments of solar panels, I have been debating Seaver Wang of The Breakthrough Institute on the subject [1] [2] [3] [4]. Seaver recently published an in-depth comparison of his calculations and mine. Seaver estimates that solar panels “emit” about 65 - 96 gCO2/kWh, while I estimate 170 - 250 gCO2/kWh.
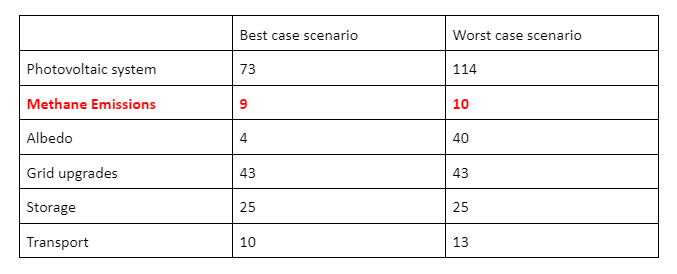
Seaver’s most recent analysis clears up a misunderstanding: my estimates are drastically higher than those in circulation not because I base my assessment on relatively old data (Lenzen 2006), but because I include five more variables in the life cycle assessment (LCA) model. If we exclude those variables - methane emissions, albedo, grid upgrades, storage, and transport - my estimates are similar to Seaver's.
Photovoltaic energy carbon intensity, China manufacturing
gCO2/kWh
However, I want to also address Seaver’s doubts about the appropriateness of including the new five variables in the LCA model of photovoltaic energy, as in my opinion the problem goes far beyond the limits set by the European taxonomy. Seaver also raised a number of other points that I will discuss.
I am addressing Seaver’s criticisms in particular not to make the discussion “personal” but because his comments represent the state of the art in the LCA of photovoltaic energy.
THE PRIMARY SOURCE
Seaver expresses misgivings about the primary source from which I extracted the life cycle inventory (LCI) of the photovoltaic system, while acknowledging that this does not inflate my estimates.
Why start from a 2006 source? There are two reasons, both methodological.
1) The more recent data do not meet the minimum research transparency requirements.
The sources cited by Seaver are perfect examples. Fan et al. 2021 write that their data comes from unspecified factories located in provinces that play a marginal role in the Chinese photovoltaic industry; Muller et al. 2021 use a life cycle inventory that has been under review for three years but hasn’t been published; the UNECE report takes data from Ecoinvent, which, as reported by Public, has no first-hand Chinese data.
What guarantees do we have that these values are representative of the Chinese photovoltaic industry? How do we know whether they have been collected in the proper way, are up-to-date, are comprehensive?
The answer is: we don’t.
In contrast, Lenzen et al. 2006 take data from the Crystal Clear project, in which a dozen European manufacturers collaborated. The list of plants is public, the data has been independently verified. This is a unique case in the LCA literature for photovoltaic energy.
2) The more recent data incorporate arbitrary and implausible assumptions.
Seaver recently updated his estimates, recalculating the carbon footprint of the aluminium frame and adjusting it for a coal-intensive scenario.
Usually, the so-called background data (i.e. the carbon footprint of the aluminium frame, glass sheet, intermediate goods, etc.) are calculated on the basis of scenarios that do not involve extensive use of coal.
Given that China also dominates the market for many of these components (inverters, aluminium frames, glass sheets), and given that many of these components are also manufactured with coal energy outside China (steel racking, steel beams, concrete), this conceptual framework is implausible.
This brings out an important difference between my worst case scenario and Seaver's. In my worst case scenario all energy inputs are coal-intensive. In Seaver's worst case scenario only the energy inputs related to the production of silicon, the system assembly, and the aluminium frame are coal-intensive.
ALBEDO
Albedo in my model
gCO2/kWh

Seaver disagrees with the inclusion of the albedo effect in the LCA of photovoltaic energy because in the LCA of thermoelectric sources waste heat is not included and the albedo effect is a short-lived climate forcer.
However, this position is at odds with the last two IPCC assessment reports.
The fifth (AR5) and sixth assessment reports (AR6) include albedo in the LCA of energy sources and specifically address the issue of surface albedo change in relation to photovoltaic energy development.
“Lifecycle assessment has also been used to quantify co-benefits and detrimental side-effects of mitigation technologies and measures, including other environmental problems and the use of resources such as water, land, and metals. Impact assessment methods have been developed to model a wide range of impact pathways. A range of approaches is used in LCA to address the climate impact of environmental interventions, starting from GHG through other pollutants (such as aerosols) to the inclusion of geophysical effects such as albedo changes or indirect climate effects (Bright et al., 2012), also exploring radiation-based climate metrics (Peters et al., 2011a)” IPCC, AR5, WGIII, Annex II
In AR5, the table detailing the emission factors of energy technologies explicitly includes albedo, but this is only accounted for bioenergy.
In AR6 (WGIII, Chapter 6), the albedo problem of solar panels is treated hastily and apparently minimised, based on the estimates of Nemet 2009.
Nemet assumes that the area covered by the panels to grow gradually reaching 580,000 km2 by 2100 and estimates that the radiative forcing by 2100 will be one eighty-ninth (1/89) of that caused by anthropogenic emissions since preindustrial times. Based on this comparison, the IPCC authors (AR6, WGIII, Chapter 6) write “Concerns about systemic impacts, such as reducing the Earth’s albedo by covering surfaces with dark panels, have shown to be trivial compared to the mitigation benefits”.
Nevertheless, given that anthropogenic emissions since preindustrial times are estimated at over 600 Gtonnes of CO2, it is clear that the global warming potential (GWP) per unit area resulting from the change in surface albedo is considerable.
The models for converting radiative forcing into CO2-eq are well established: I have used the one by Akbari et al. 2012, reviewed in the IPCC Special report on global warming of 1.5°C.
Zeke Hausfather correctly points out that the surface albedo change is a short-lived climate forcer. When the photovoltaic plant is decommissioned, the surface quickly recovers its original albedo, and the extra-heating will disappear within a few years. But the same applies to methane, which has an atmospheric lifetime of 12 years, or to difluoromethane, which has an atmospheric lifetime of 5 years.
The IPCC assessment reports have devoted a chapter to short-lived climate forcers for 20 years and since they are included in every climate model, there is no logical or methodological reason to exclude the albedo effect from the LCA of energy sources.
On the other hand, the reason why anthropogenic heat flux (AHF) is not included among the climate forcers has been explained repeatedly, including in a recent hard-hitting editorial by Earth System Dynamics:
“On the other hand, it is also well known and established that anthropogenic heat emissions can affect local climate (e.g., Block et al., 2004; Forster et al., 2007), especially in urban and highly populated areas, resulting in the urban heat island effect. Gridded datasets are available that show the magnitude of this heat release (Flanner, 2009; Jin et al., 2019). Studies that incorporated this effect in climate models showed little, if any, effect on global climate (Flanner, 2009), consistent with the energy balance estimate described earlier. That human activity releases heat into the atmosphere is therefore not a new insight”
GRID UPGRADES TO INTEGRATE PHOTOVOLTAIC ENERGY AND STORAGE
Grid upgrades and storage in my model
gCO2/kWh

Seaver considers transmission upgrades and storage to be out-of-scope, which is in line with IEA PVPS Task 12 methodology guidelines, which reads:
“AC electricity may differ in dispatchability and intermittency. Electricity production with one technology hardly meets all the demand at all times; thus, mixtures of power generating technologies are typically deployed. Aspects of dispatchability or intermittency of AC electricity produced with different technologies shall not be addressed on technology level but on the level of grid mixes provided by utilities (see also Carbajales-Dale et al. 2015).”
However, this recommendation is based on a misleading assumption.
On a technological level, thermoelectric and nuclear plants have a theoretical capacity factor approaching 100%, i.e. they would be able to generate electricity more than 90% of the time. The reasons why most thermal plants have a capacity factor of between 40% and 80% are economic (wholesale electricity price, raw material price) and strategic (diversification of energy sources).
Photovoltaic technology, on the other hand, has inherent limitations such that a photovoltaic plant cannot produce for more than 2,000/2,500 (equivalent) hours per year. To equate the routine and extraordinary maintenance of thermoelectric and nuclear power plants with the natural intermittency of photovoltaic energy is specious.
Moreover, the target of the energy transition is the carbon neutrality of the energy sector as a whole, so the LCA of any power technology should be done always on the grid level.
Materials footprint of low-voltage transmission line (LV), medium-voltage transmission line (MV), high-voltage transmission line (HV)
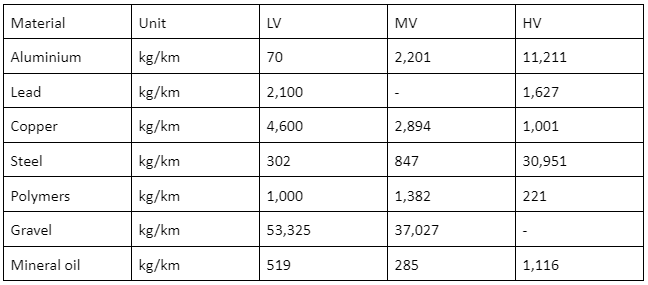
Data: Treeze ltd
Seaver notes that any new power plant of any generation technology can add significant transmission requirements to the grid but I do not really agree with this statement, because it is more true in theory than practice. As a recent Economist analysis notes, new (thermoelectric) power plants have been built close to grid connections in the last decades.
On the contrary, solar requires orders of magnitude more land per MWp than natural gas, coal, or nuclear (for example, one of the largest solar plants in the world, Ghonge, takes up 50 square kilometres of land but generates only one-sixth the energy of the Diablo Canyon nuclear plant in California). A solar-heavy grid will have a larger number of power plants than the current grids it is replacing, and many solar plants will be located far from city centres on land with no existing transmission infrastructure. Thus, by choosing to focus so heavily on solar, governments and corporations are increasing transmission-related emissions that are otherwise avoidable. Plus, this solar-centric approach means that most countries will see growth in solar that exceeds their current transmission resources, even if their first installations required no transmission additions.
Will electricity produced by gas-fired power plants also flow on the same transmission line? It is likely, but if that transmission line has become necessary because photovoltaic plants have been built in some sectors of the electricity grid, then the carbon footprint of that transmission line is uniquely related to the development of photovoltaic energy.
Clearly, these evaluations must be made at grid level and not at plant level, an average value must be identified (km of transmission lines per MWp), since, for the time being, there are no spatially and temporally explicit models that delve into this issue.
In the white paper, I estimated that the integration of photovoltaic systems into the electricity grid requires the equivalent of 20 km of low-voltage transmission line per MWp, based on the policy documents [1] [2] [3] of some European governments. They certainly need to be refined, but again I have tried to take as conservative an approach as possible.
With regard to storage, Seaver is right that increasing solar deployments does not necessarily mean more battery storage on the grid. However, in practice, developers are now including storage with most new solar projects because of the economic benefits. Solar panels can’t choose when to generate power, so high concentrations of solar panels lead to gluts in supply during certain times of day, which deflate the value of the produced electricity. Storage allows solar operators to spread their generation to times of day where power is more expensive, and thus more profitable.
Additionally, the carbon intensity must be buffered, just as is conventionally done for the Energy Return on Energy Investment (ERoEI). Tools such as LCA or ERoEI are designed to make comparisons and it makes no sense to make unweighted comparisons between a technology that can produce 2,000-2,500 (equivalent) hours per year with a technology that can produce 8,000 hours per year.
A buffer must be applied. The only two possible buffers for photovoltaic energy are overcapacity or storage technologies (more reasonably a mix of the two). I am waiting for more realistic models than Jacobson's to make more detailed calculations.
TRANSPORT
Transport in my model
gCO2/kWh

In the white paper, I estimated transport-related emissions throughout the supply chain of the photovoltaic industry by applying the global ratio of shipping emissions to industrial emissions (7%).
Seaver thinks my estimates are excessive, but I believe he is not considering the complexity of the photovoltaic industry's supply chain.
For example, the Chinese coal mines are located in the north-central provinces, while the manufacturing industry is concentrated near the coast. Therefore, before being burnt in power plants, the needed coal travels a few thousand kilometres by train (assuming it is not from distant Australia). According to my estimates, in the worst case (100% coal energy supply), 1,200 kg of coal are needed to produce a 1 kWp photovoltaic system. 500 are needed for silicon production and let’s assume they do not travel. The other 700 kilograms do travel. 700 kg is about 4 times the mass of the finished product (1 kWp modules, inverter, racking etc). And this applies to coal as well as bauxite, copper ore concentrate, glass and concrete, gravel etc.
Moreover, globalisation has exacerbated the specialisation of industrial clusters, multiplying the transport of intermediate and semi-finished products. This means that each material travels several times, in different forms.
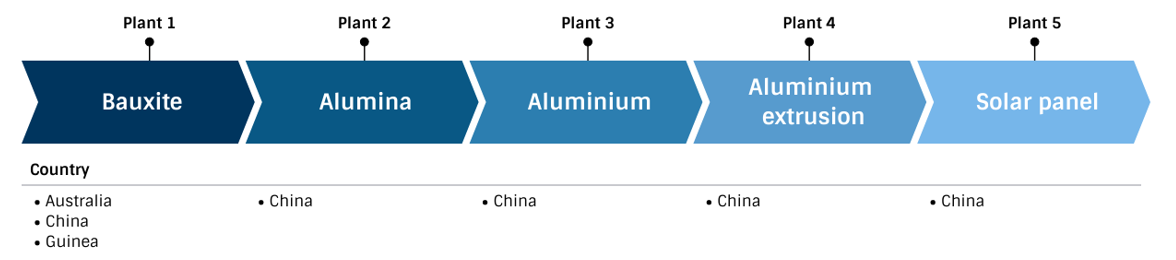
Aluminium frame, average supply chain
I think that, in the absence of more precise information on the supply chain structure of the photovoltaic industry, using the global ratio of shipping emissions to industrial emissions is a methodologically robust choice.
METHANE EMISSIONS
Methane emissions in my model
gCO2/kWh
To estimate coal mining-related methane emissions, I used the emission factor of underground mines from IPCC AR5 WGIII Annex II. Seaver points out that some silicon purification plants are fuelled with coal from open-pit mines. This is an interesting point and should be investigated further. However, in the absence of a more precise picture of the supply chain of the Chinese photovoltaic industry, I think it is more correct to use the emission factor of underground mines, since more than 95% of the coal mined in China comes from shaft mines.
THE CONSPIRACY RED FLAG
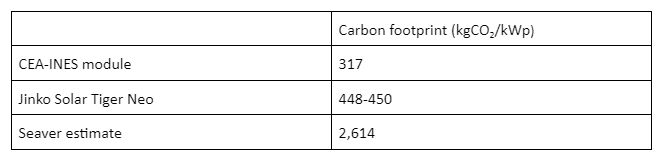
Seaver writes “I will say another thing, which is that while accusations that solar PV LCA data are doctored or conceal the truth about high CO2 solar modules might be borderline conspiratorial”. Let's look at an example. Earlier this year, the French research institute CEA-INES presented a new solar panel to the media that was designed to be the most environmentally-friendly ever devised: wood frame instead of aluminium, 2 mm glass sheet instead of 3.2, silicon made in Norway, low-carbon manufacturing. The (certified) carbon footprint is 317 kgCO2/kWp. Meanwhile, Chinese manufacturers who don’t certify their data and power most of their manufacturing with coal have been certifying their panels’ carbon footprints in the range of 400-450 kgCO2/kWp. Something’s fishy here. To call the doubts about the numbers provided by Chinese companies “conspiratorial” is naive, in my opinion. Plus, Seaver's own estimates, which substantially exceed the well-regarded UN, show that something is wrong.
Photovoltaic panel, carbon footprint
THE ITALIAN JOB
Seaver believes that the Italian case is unrepresentative because a large fraction of Italy's photovoltaic installed capacity is on average small and located in sub-optimal regions.
These characteristics, however, are not due to bad policy choices but to the social structure and geography of the country. And they are quite common throughout Europe.
Italy is a highly man-made country with a huge historical, cultural and natural heritage. Finding 500 hectares easy to connect to the grid where to build a photovoltaic plant without running into environmental and cultural constraints or an urban centre is very difficult.
Moreover, Italy is a small but elongated country. This means that in southern Italy the conditions for installing photovoltaic systems are quite fair, but northern Italy has very similar climate conditions to Germany.
As if that were not enough, in contrast to the US, Italian California straddles a foggy plain and high mountains. More generally, the locomotive of the Italian economy is in the north and the depressed areas are in the south (this also explains why rooftop installations are concentrated in the north, despite the sub-optimal solar radiation).
Among other things, this means that photovoltaic electricity would have to be brought from the south to the north, but the existing connections are already saturated.
This geographical and social framework makes Italy an advanced case study, a laboratory where bottlenecks materialise earlier and more clearly than elsewhere.
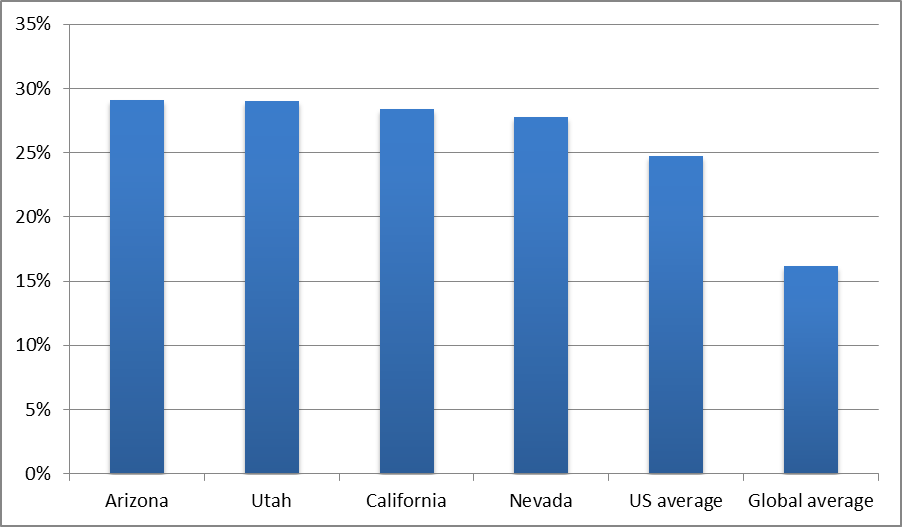
Moreover, the global weighted average capacity factor for utility-scale photovoltaic systems installed in 2020 is 16.2%, i.e. about 1,400 (equivalent) hours per year. The out-of-scale figure is the US figure, not the Italian one.
Average capacity factor of utility-scale photovoltaic systems installed in the US between 2014 and 2017 vs. global weighted average capacity factor of utility-scale photovoltaic systems installed in 2020
With regard to the albedo of rooftop installations, Seaver's observation must be reversed. In my best case scenario, the albedo variation is 0.03, which is in line with Copernicus' average satellite measurements of urban albedo. A clearly optimistic figure, since it includes asphalt surfaces. On the contrary, in the case of white roofs (very common in southern Italy) the albedo variation hypothesised in my worst case scenario is largely underestimated.
TECHNICAL DETAILS
LIFESPAN
Seaver still believes it is more correct to set a lifespan of 30 years, despite the fact that the source he cites in the white paper recommends setting a lifespan of 25 years, based on a survey of over 400 warranties.
Seaver writes: “The U.S. National Renewable Energy Laboratory uses a 30-year assumed lifetime for utility-scale solar PV projects in its regular cost benchmarking reports. Industry surveys in both the United States and Europe also establish that banks, developers, and industry professionals regularly assume project lifetimes of at least 30 years for new projects today. Money speaks, and the fact of the matter is that one can persuade an asset manager today to invest in a solar PV farm by arguing that it will operate usefully for 30 years”.
Money speaks but does not always say the truth. Taking operators' assumptions for granted in a framework of strong public incentives and privileged financing rates is dangerous at the very least. Unsurprisingly, there are already cases of solar plants not meeting the investors' expectations. For example, the Solar Risk Report 2021 by kWh Analytics finds that photovoltaic projects persistently underperform (underperform beyond the first year) 13 times more frequently than expected by operators.
Moreover, these assumptions are based on a logical contradiction: if the seller guarantees that the panel will last 25 years, how can the buyer guarantee that it will last 30? As I point out in my original white paper, Harvard Business Review recently reported a persuasive study that predicts that solar owners could replace their panels far sooner than the 25 year lifespan for economic reasons.
Seaver calculations revised with appropriate lifespan
Conservative Italy case: 1,137 *
3025 * 0.912 * 0.944 =29,36624,472 lifetime full load hoursModerately good Italy case: 1,320 *
3025 * 0.912 * 0.944 =34,09328,411 lifetime full load hoursModerately better Non-Italy case: 1,752 *
3025 * 0.912 * 0.944 =45,25037,709 lifetime full load hours
SINGLE-AXIS TRACKER
In two of the three scenarios he elaborates, Seaver includes the single-axis tracker in the photovoltaic system.
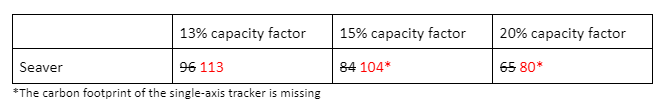
As Seaver rightly writes, the tracker increases plant output by 10-20% (15% in Seaver's model). However, Seaver does not include the tracker’s own energy consumption, which expends about 5% of the energy produced by the plant; this parameter must be added. In addition, the carbon footprint in the upstream emissions must also be added.
Based on a survey of about 50 technical sheets which is partially disclosed in my white paper, I estimate that the average weight of the single-axis tracker is about 50 kg/kWp. Depending on the manufacturer, the main body of the tracker can be made of different materials: galvanised steel, aluminium, steel alloys. Usually the moving parts are made of stainless steel and the electric motors of aluminium. Consequently, estimating an average value is not easy. For sure, it is at least a few hundred kg of CO2 per kWp.
Seaver calculations revised
Conservative Italy case: 1,137 *
3025 * 0.912 * 0.944 =29,36624,472 lifetime full load hoursModerately good Italy case: 1,320 *
3025 * 0.912 * 0.944 * 0.95 =34,09326,990 lifetime full load hoursModerately better Non-Italy case: 1,752 *
3025 * 0.912 * 0.944 * 0.95 =45,25035,823 lifetime full load hours
GRID LOSSES
Seaver correctly points out that “Enrico assumed average grid losses associated with utility-scale projects, despite choosing an Italian context dominated by residential solar where losses would be minimal”. I asked GSE, the Italian grid operator, for the disaggregated data a fortnight ago. They responded and said they will send it to me in early September. I intend to update the white paper as soon as they are available, differentiating the estimates between rooftop installations and ground-mounted plants. In any case, the recalculation is unlikely to reward rooftop installations, since in about half of the Italian regions these types of installations do not produce more than 1,000 equivalent hours per year.
BALANCE OF SYSTEM
Seaver underestimates the consistency of the balance of systems. It is not just about the inverter: there are the mounting structures (racking + beams), there is the concrete, there are the cables and the high-voltage transmission line connecting the system to the grid. All in all, tons of processed materials per MWp. Consequently, the energy mix with which these materials are made significantly influences the carbon footprint of the photovoltaic plant.
CARBON INTENSITY OF COAL PLANTS
In my model, the upper bound of the carbon intensity of coal-fired power plants is in line with the Chinese government's 2019-2020 caps (1,150 gCO2/kWh, only direct emissions). Recent literature attributes an overall carbon intensity (including mining and methane emissions) of 900 to 1,600 gCO2/kWh to Chinese coal-fired power plants.
CONCLUSION
In conclusion, I am glad to see that we had the opportunity to discuss the truly innovative character of the model in my white paper. I hope that the debate over the carbon-intensity of solar production continues, especially considering the opacity of the photovoltaic industry's supply chain.
As far as the results of my white paper are concerned, I do not feel that any factors have yet emerged to invalidate them, although I would like to supplement some of the points raised by Seaver.
Certainly, as Seaver points out, optimal positioning can substantially reduce the carbon intensity of photovoltaic energy, but this observation has geopolitical and technical consequences.
Geopolitically, the impact of positioning on solar performance points to the harsh reality that many regions have very poor solar resources, indicating that photovoltaic energy is not a suitable decarbonisation tool for all geographical contexts. In Germany, for example, it is not.
From a technical point of view, positioning highlights why it is important to include grid upgrades, storage and grid losses.
Photovoltaic energy poses new logistical and technological problems, not only because it is intermittent but also because it is geography-dependent. And, depending on geographical and logistical context, the scale of carbon emissions generated by overcoming these two obstacles through new storage and transmission lines can nullify the benefits of building solar in the first place.
I’d like to stress what the magnitude of the difference between Seaver's estimates and the UN’s mean for solar energy. Seaver’s estimates (as well as mine) place photovoltaic energy outside the perimeter of the EU taxonomy in the whole of north-central Europe (from France and Germany upwards), as the limit for new power plants is 100 gCO2/kWh. This evidence should underline the political significance of the technical mistake made by the IPCC in the last two Assessment Reports.
These considerations shed a completely new light on photovoltaic energy. Solar is not the cornerstone of decarbonisation, but is only useful under well-defined conditions: high productivity and high grid integration.